Monday 17 May 2010

Case study: Life expectancy


One of the central claims of The Spirit Level is that 'less equal' countries have lower life expectancies than more egalitarian countries. Its authors claim that the psychological stress of living in a less egalitarian society affects the health of all—rich and poor—and that this manifests itself in lower life expectancies. 

To demonstrate this they show a graph that looks very much like this:


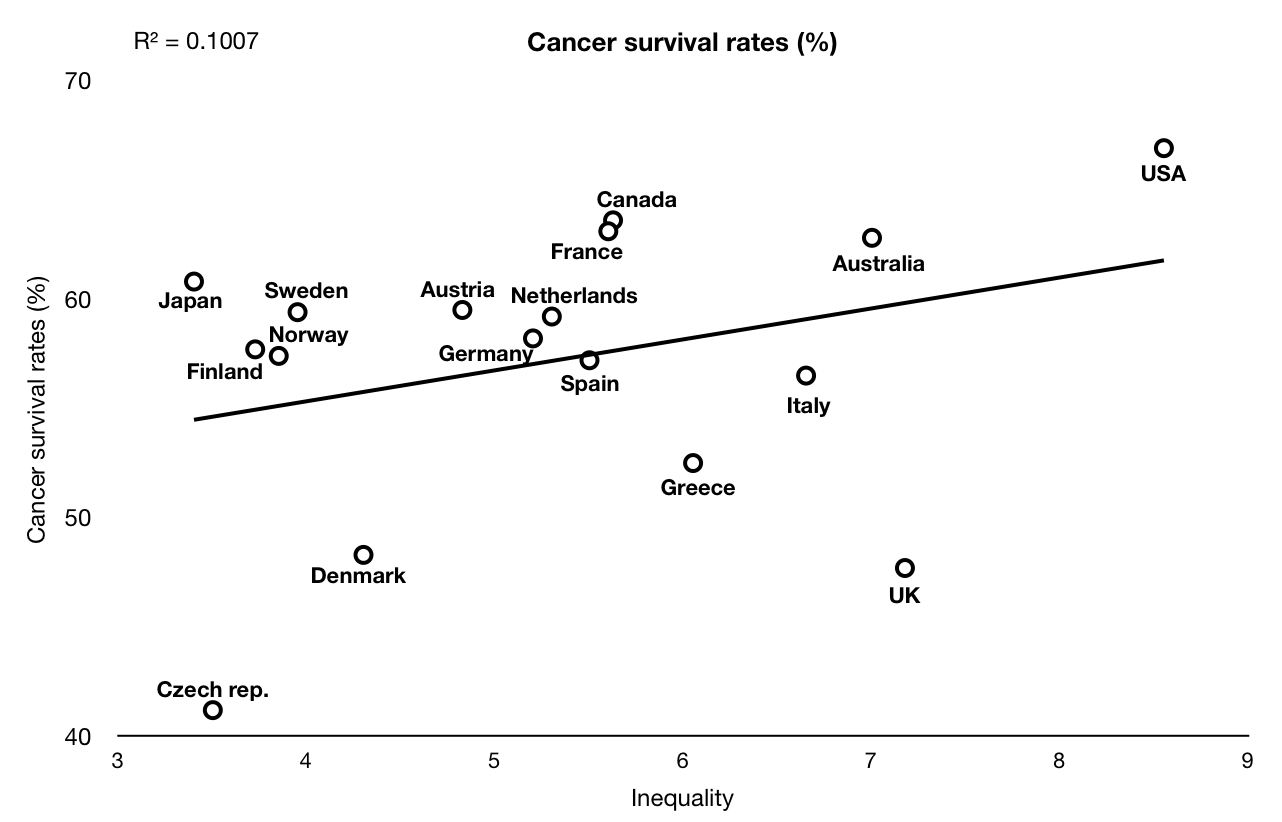
Inequality is shown on the horizontal axis and is the difference between the richest 20% and the poorest 20% (eg. in Sweden, the richest 20% are 4 times wealthier than the poorest 20%). As you can see from the graph, there seems to be a downward trend in life expectancy from the more equal countries, especially Sweden and Japan, to the less equal countries. The low life expectancies of Denmark and Finland should make us wonder whether this graph really proves that egalitarianism results in good health, but a broad correlation remains nonetheless.

But there are two major problems. Firstly, a number of wealthy societies are missing from this graph. In particular, where are Hong Kong, South Korea, the Czech Republic, Slovenia? All of them are wealthier than Portugal and should be shown. 

Secondly, there are questions over the data used to ascertain life expectancy. Wilkinson and Pickett use figures from the United Nations Human Development Report, a respected and accurate source, but they use data from the 2004 edition. This is an odd choice because elsewhere in The Spirit Level, the authors rely on the 2006 edition. They even use life expectancy figures from the 2006 report elsewhere (the graph on page 7) so we know they were aware of them. 

This is their reference for a graph they use to show life expectancy earlier in the book...


But this is their reference for their graph showing life expectancy against inequality...


So why the use of old statistics and a carefully selected sample group? If we look at the data from the UN's 2006 report—and include all relevant countries—a very different picture emerges.


The association between inequality and life expectancy has disappeared, replaced by a modest trend in the opposite direction. And to prove that the 2006 report is not an anomaly, here are the results from the 2009 report:


Again, there is no correlation. Indeed the three worst performing countries have a very equal distribution of wealth (Czech Republic, Slovenia and Denmark). 

It's worth noting that the inequality/life expectancy hypothesis is not new. It first came to prominence in a 1992 British Medical Journal article, written by none other than Richard Wilkinson. That article inspired a flurry of research and, in The Spirit Level, the authors refer to a “vast literature” on the subject. There is, however, no mention of how much of this vast literature was written by Wilkinson himself, nor that much of the rest was critical of his theory. 

His BMJ study was debunked at length in the same journal in 1995 by Ken Judge. Judge pointed out numerous errors in Wilkinson’s research, including the use of “inappropriate” data. He criticised Wilkinson for using the lowest 70% of families as a measure of inequality when a more conventional measure is the bottom 10% or 20% of individuals. “The suspicion,” wrote Judge, “must be that the choice is derived from the data” (ie. Wilkinson was cherry-picking).

When Judge recalculated the data based on the more usual measure of income per head, the association between life expectancy and inequality disappeared. Judge concluded:

In retrospect, it seems extraordinary that a predominantly monocausal explanation of international variations in life expectancy should ever have been regarded as plausible. It is much more likely that they are the product of many influences, which probably interact over long periods of time.

This was only common sense. Further studies conducted in Denmark and Japan failed to support Wilkinson’s hypothesis and although some studies showed an association between income inequality and life expectancy in the USA, other evidence showed that this was more likely to be due to education, underinvestment and other confounding factors. In 2002, a large study of wealthy European countries showed no association between inequality and life expectancy.

In The Spirit Level, Wilkinson and Pickett cite a 1996 editorial from the BMJ which discussed the “big idea” that “the more equally wealth is distributed the better the health of that society.” At that time, the BMJ was broadly supportive of the theory but research into it was still in its infancy. Wilkinson and Pickett do not mention the editorial that appeared in the same journal six years later, which concluded: 

Now that good data on income inequality have become available for 16 western industrialised countries, the association between income inequality and life expectancy has disappeared.

By the time The Spirit Level was published, the slender circumstantial evidence upon which Wilkinson had made his case had been obliterated with the passing of time. Rather than change the theory to fit the facts, he and Pickett ignored the facts and persisted with the theory. In practice, that meant using old data when they were quite aware that more recent data was available.

Sunday 16 May 2010

God and the movies

Maybe it's because I'm a bit of a statistics nerd, but once I start comparing countries, I find it difficult to stop. The fact is that associations are everywhere and the possibilities opened up by ecological epidemiology are endless. For example, here are two statistically significant associations showing belief in God and cinema attendance (against inequality).


Based on the World Values Survey. 'How important is God in your life?' Percentage answering 'very important'.


Based on Nationmaster data.

I show these graphs because they happen to show a strong correlations—stronger than most of The Spirit Level graphs. They are, as Wilkinson and Pickett might say, too strong to be the result of chance. But if they are not due to chance, how do we explain why people in less equal countries are more likely to believe in God and more likely to go the cinema? Does egalitarianism cause atheism? Does religion cause inequality? Or does going to the cinema make people believe in God? 

The possibilities are limitless. But even if you exclude chance as a possibility (and that would be very hasty), explaining them in terms of income inequality requires a vivid imagination and a near-obsession with wealth redistribution. 

As ever, our willingness to accept statistical associations depends on our susceptibility to the underlying message. Perhaps a socialist atheist would find these associations compelling. Or maybe a Christian film buff could use them as an argument in favour of capitalism. The rest of us might shrug our shoulders and say 'so what?'
 

US states


[This is a discussion of the issues mentioned on page 15 of The Spirit Level Delusion]

The Spirit Level Delusion focuses on differences between nations. It does not look at differences between US states. There are several reasons for this. 

Firstly, since—as I show—inequality does not influence outcomes on an international level, it is highly improbable that it would influence outcomes between regions within a country. Although the USA is a diverse place, there are greater cultural differences between, say, Israel and Japan than there are between Texas and California. Perhaps this explains why, even by the standards of The Spirit Level, the correlations shown for US states are weak. It is a stretch to say that the graphs they show on, for example, pages 59 and 141 are indicative of a genuine causal relationship.

Secondly, a discussion of US states would make the book twice as long and, for the reasons above, this would be an unnecessary strain on both reader and author.

Thirdly, and most importantly, the health and social problems highlighted in the USA are more plausibly associated with absolute income than with inequality. Wilkinson and Pickett deny this, but their own evidence contradicts them. On page 22 of The Spirit Level, they show two graphs. The first shows their index of health and social problems against inequality, the second shows the same index against 'national income' (this must be a mistake—they surely mean 'state income'). These data are shown below.


Wilkinson and Pickett state that the second of these graphs shows no association between income and health and social problems, but even the casual reader can see that this is not true. Clearly, the worst afflicted states are the poorest. Wilkinson and Pickett divert the reader's attention from this fact by not showing the linear regression line. Had they done so, the graph would have looked like this...


There is a reasonably strong correlation here. The poorest states do worse and none of the richer states do badly. It is, however, worth asking why the correlation is not even stronger. The answer lies in the dozen states in the bottom left corner. These states do not show a close fit, but that won't concern the people who live there. All these states are doing better than would be expected from their income. This is no great surprise. These are sparsely populated, predominantly rural, ethnically homogenous Northern states like North Dakota, Wyoming and Montana. No one pretends that wealth is the only factor that makes a state or country successful, but as this graph shows, it certainly helps. Look at the top right-hand corner. Those are the states that have higher state incomes but perform badly. Don't see any? Exactly. 

Connecticut, Massachusetts and New York hold the key to understanding this data. They are outliers in Wilkinson and Pickett's inequality graph (above) and consistently fail to follow the pattern in The Spirit Level's other graphs. How three very unequal states do so well is an important question which Wilkinson and Pickett never address, but the answer is simple. They do well because of their wealth—inequality is irrelevant. Massachusetts performs so well because it is the third richest state. Connecticut and New York are outliers on the inequality graph but are a perfect fit on the income graph. 

Mississippi and Louisiana perform very poorly under most criteria. They have the lowest life expectancies and the highest rate of infant mortality of any US states. But they are also the poorest and third poorest states respectively. This, more than inequality, must be considered the real driver of outcomes in these states. 

We cannot rule out some indirect effect from inequality, but any effect is far from proven. The apparent correlation between inequality and outcomes is not, in itself, reason enough to cry causation. Other factors, such as the proportion of African-Americans in the population (shown below), show a stronger correlation but here, too, it would be foolish to insist on a direct causal relationship. 


Many other such graphs could be created showing strong correlations—some valid, some spurious—and that is only to be expected. Outcomes in societies are dependent on countless cultural, political, economic and demographic factors that interweave over many years. This is an obvious point to make, but in the light of The Spirit Level's monocausal 'theory of everything', it is one that needs to be reasserted.


Graphs and sources


All the statistics in The Spirit Level Delusion are there to be checked. Here are the sources...


Life expectancy

See Chapter 1 of The Spirit Level Delusion and case study.


Quality of life


See Chapter 3 of The Spirit Level Delusion


Homicide (without USA)


See Chapter 4 of The Spirit Level Delusion

The 'link' between inequality and homicide rests on the USA's unusually high murder rate. When this obvious outlier is excluded, the association disappears. A correlation that depends on one outlier is, of course, no correlation at all. 

All this data comes from the 1990s. Portugal's murder rate has since fallen to around the same level as Sweden, further undermining the inequality hypothesis.


See Chapter 3 of The Spirit Level Delusion
Source: World Values Survey (go to 'Online data analysis') 


Happiness


See Chapter 3 of The Spirit Level Delusion
Source: World Values Survey (go to 'Online data analysis') 


Happiness against national income


See Chapter 3 of The Spirit Level Delusion
Contrary to Wilkinson and Pickett, there is ample evidence that economic growth benefits the population even at a very high level of development. The happiness survey is one example of this.
Source: World Values Survey (go to 'Online data analysis') 
National income figures: World Bank 2008


Births to women aged 15-19 years


See Chapter 3 of The Spirit Level Delusion
There is no association with inequality for the majority of countries. Rates tend to be somewhat higher in English-speaking countries, but the rate in countries like Hungary, Hong Kong and Singapore suggest that this is not due to inequality. The slightly higher rate in Portugal is more likely to be due to the higher incidence of teen marriages and abortion being illegal when this data was collected.


Divorce


See Chapter 3 of The Spirit Level Delusion


Prisoners per 100,000


See Chapter 4 of The Spirit Level Delusion
Source: United Nations Surveys on Crime Trends and the Operations of Criminal Justice Systems (CTS) (Ninth edition, or earlier when unavailable)


Recorded crime per 100,000


See Chapter 4 of The Spirit Level Delusion
There is an inverse relationship between inequality and the crime rate. There is also—but not always—an inverse relationship between the prison rate and the crime rate.


Education


See Chapter 9 of The Spirit Level Delusion
The countries of Southern Europe tend to perform least well but the performance of places like Hong Kong and Australia—as well as the lack of any statistically significant association—strongly suggest that inequality is not the cause of this.
Source: The Programme for International Student Assessment (PISA). Combined maths, literacy and science scores (2006)


Government spending on foreign aid


See Chapter 6 of The Spirit Level Delusion
Source: OECD (2008)

Per capita donations to charity


See Chapter 6 of The Spirit Level Delusion.
The trend towards more equal countries giving more in state aid is counter-balanced by the tendency for less equal countries to give more in individual, voluntary donations.
Source: Salaman (1999). See also Charities Aid Foundation (2006)


Sources for other graphs shown in The Spirit Level Delusion:

Inequality: UN Human Development Reports. Same methodology used as in The Spirit Level.

Smoking rates: Nationmaster


Alcohol Consumption: World Health Organisation (2004)

Infant mortality: United Nations World Population Prospects (2008) 


Recycling: Planet Ark (2004)


Saturday 15 May 2010

Foreword by Patrick Basham


In recent years, anti-capitalist treatises have done very well on the bestseller charts and also atop many a book reviewer’s ‘Best of the Year’ list. The most obvious example of this tendency of book buyers and critics alike to embrace statist economic thinking is The Spirit Level: Why more equal societies almost always do better, written by Richard Wilkinson and Kate Pickett. Although Snowdon reserves some of his analytical slings and arrows for several of Wilkinson and Pickett’s ideological soul mates, most of his considerable empirical arsenal is unleashed on the arguments presented in The Spirit Level.

When Christopher Snowdon first talked about The Spirit Level with me, we discussed the book’s supposedly avant-garde thesis. Both of us were surprised that such an anachronistic perspective on economic policy could strike so many members of the media and the political class as both new and relevant to our current economic predicament. Crudely stated, Wilkinson and Pickett advocate that the State (or, rather, those Wise Persons who control the levers of State power) play a zero-sum game with our economic lives.

For me, personally, Wilkinson and Pickett’s thesis brings back vividly unpleasant memories of an undergraduate year in the mid-1980s that I spent, in part, being taught about socio-economic matters by my sociology tutor, a newly-minted Marxist feminist PhD. She had little tolerance for my ‘tax cutting equals economic growth equals more employment’ economic model, which she termed, ‘An ungodly synthesis of the worst of Reaganism and Thatcherism’ (which I thought oddly religious rhetoric for such a fanatical atheist). ‘On the contrary, Patrick,’ she would inform me, ‘you need to get over your fixation with economic growth. Rather than putting all our effort behind growing the economic pie, we should instead limit the pie to its current size, and then focus our energies on the issue of how we shall divide it up.’

There it was: Eighties-style socialist fundamentalism in a nutshell. Two sentences that encapsulated the British Labour Party’s economic thinking at the height of the Left’s control of the party and at the nadir of the party’s electoral relevance. Fortunately, I thought at the time, and for some time afterwards, such thinking has had its day. But I was wrong.

Analogous to an Economic Groundhog Day, our polity continues to relive the economic debate of the early 1980s, which hung on the question: Is a tightly regulated, high tax, nationalised economy better for society than a deregulated, low tax, privatised one? Many of us thought, naively it turns out, that question was answered a generation ago with a resounding, No. With the advantage of hindsight, however, it is clear that we were correct only in an empirical sense. In the political world, the economic flat-earthers never went away; they merely faded into the policy background to await their next moment in the fiscal sun, which arrived in 2008 in the form of a global recession. And, over the past two years, how the Wilkinsons and Picketts of this world have enjoyed their intellectually lazy, empirically hazy days of summer.

Hence, the need for an intellectual push-back the likes of which Christopher Snowdon so comprehensively provides in this volume. Most impressively, perhaps, Snowdon’s refutation of Wilkinson, Pickett et al. is both measured and finely balanced. When confronted with arguments and ‘facts’ that constitute little more than ‘junk economics’, it is very tempting, although rarely advantageous, to focus upon either the ignorance or the ineptitude of the researcher(s) in question. To his considerable credit, Snowdon resists the temptation to match his opponents’ tactics.

In striking contrast to so much contemporary anti-capitalist rhetoric, Snowdon’s words are calm, considered, and constructive. He simply lets his impressive empiricism do the talking for him. Having marshalled an immense body of evidence, he needs neither overheated language nor overblown conclusions.

Snowdon’s serious and careful treatment of his subject illustrates what, on our better days, we hope the Democracy Institute is all about. His ability to find the methodological flaws within specific pieces of research, unearth and explain contrasting pieces of research, and present this set of conclusions in an accessible manner is a skill possessed by a comparative few and one for which his readers should be thankful.

I am especially thankful for the realisation that, although I am an alleged expert in several of the specific areas covered in his book, I learned a considerable number of interesting things while reading it. I strongly suspect that everyone who reads this book will experience similar growth.


Patrick Basham

Democracy Institute

London

April 2010

Working hours


On page 224 of The Spirit Level there is a graph showing working hours against inequality. This graph is taken verbatim from an obscure article titled 'Emulation, inequality, and work hours: Was Thortsen Veblen Right?' (published November 2003 and available to read here).

It looks like this:


There are several aspects about this graph that set it apart from others shown in The Spirit Level

For one thing, it uses a very different measure of inequality. In The Spirit Level, Wilkinson and Pickett use the gap between the highest and lowest 20% of earners. The graph above uses the ratio of rich to middle (90th:50th percentile). This has a dramatic effect on where the countries appear on the inequality spectrum. For example, it makes France suddenly much more unequal than the UK and Italy. 

Secondly, we can only identify 10 countries. We don't know whether the unidentified countries are rich or poor, nor do we know if all the countries studied in The Spirit Level are shown here. Where, for example, is Japan? 

In short, the graph Wilkinson and Pickett use is not comparable to their other graphs. Rather than relying on a solitary article, the best practice would be to seek out the actual figures and plot a graph along the same lines as the others in The Spirit Level. If we do that, a very different picture emerges:


The data for this come from the OECD and relates to 2004. Only OECD countries are shown, hence no Israel, Slovenia, Singapore or Hong Kong. There is no significant correlation between long working hours and inequality. Korea and Greece work the longest hours despite being neither particularly equal nor particularly unequal. 

Some of the Northern European countries (the Netherlands, Germany, Belgium, France) work fewer hours but one only needs to compare the least equal nations (Portugal, the USA) to the most equal nations (Japan, the Czech republic, Finland) to see that there is little difference and that, therefore, it is highly unlikely that working hours are dictated by inequality.

A much stronger association can be seen if one compares working hours against national income. There is a suggestion in the graph below of working hours declining as countries grow wealthier.


This correlation between wealth and shorter working hours is supported by historical data. The graph below comes from the article cited by Wilkinson and Pickett (above). The trend towards shorter working hours in the past 50 years (indeed, the past 100 or 200 years) is undeniable. The decline has levelled off in several countries since around 1990. It would be interesting to see figures from 2000-10.


The balance of evidence suggests that shorter working hours are associated with national income, not income equality.


Women's empowerment


On page 60 of The Spirit Level, a graph appears showing 'women's status and inequality in rich countries'. According to Wilkinson and Pickett, this graph shows that "there is a tendency for women's status to be better in more equal countries" and that "the link between income inequality and women's status cannot be explained by chance alone."

The graph uses an index of Wilkinson and Pickett's own devising which is impossible to replicate or verify. There is, however, a ready-made index of gender empowerment used by the United Nations. The graph below shows data as displayed in Wilkinson and Pickett's favoured 2006 edition of the UN's Human Development Report.


Plainly there is no correlation with inequality. The Scandinavian countries do better while the two most equal Asian countries do particularly badly. (There is no data for Hong Kong).

Loneliness


An important argument put forward in The Spirit Level is that people in less equal societies feel alienated and lonely. This, say Wilkinson and Pickett, goes hand-in-hand with the breakdown of community life. As I show in The Spirit Level Delusion, there is no evidence that people in countries such as the USA and Australia are less involved in the community than the people of Japan and Scandinavia. If anything, the reverse is the case.

One other small piece of evidence is worth mentioning. The data in the graph below come from an international survey of 15 year olds which asks them whether they agree with the statement 'I feel lonely'. This comes from the UNICEF report on child well-being (2007) and the results are shown below.


There are no data for the USA, Korea, Singapore, Slovenia or Hong Kong. I have excluded Japan from the graph to maintain scale but only because this very equal nation has a 'loneliness' score of 51%, a quite extraordinary figure when all the other countries come well under 10%.

As ever, I am reluctant to claim any kind of cause-and-effect here. Without an explanation for the correlation, it is foolish to cry causation. This graph does, however, act as further evidence that people in more equal countries are not happier, less alienated or less lonely.

Cancer survival


Based on 5-year survival for breast, colorectal, and prostate cancer. From 'Cancer survival in five countries: a worldwide population-based survey (CONCORD)', M. Coleman et al., Lancet Oncology, 2008

Wednesday 5 May 2010

Publication date & book launch


The Spirit Level Delusion: Fact-checking the Left's New Theory of Everything will be published on 17th May 2010.

The book launch will be held at the Institute of Economic Affairs on 11th May at 6.30pm. To attend please RSVP here.


Saturday 1 May 2010

Alexis de Tocqueville


I discuss Wilkinson and Pickett's misrepresentation of Alexis de Tocqueville in chapter 9 of The Spirit Level Delusion. To imply, as they do, that Tocqueville was an early socialist is laughable (you can read what he thought of socialism here). 

There is one thing to add regarding Tocqueville's admiration of the 'equality of conditions' enjoyed in 1830s America. Anyone who has read Tocqueville's work (or, indeed, understands 1830s America) will be aware that he was referring to what we would today call equality of opportunity or equality of status. He certainly was not talking about equality as defined by Wilkinson and Pickett, ie. equality of outcome.

'Equality of conditions' is a somewhat ambiguous phrase which, as Hugh Brogan explains in his biography of Tocqueville, relies on a mistranslation:

Equality of status, or in AT's French, egalite des conditions. This is usually translated as 'equality of conditions', but this is misleading since nowadays it seems to imply economic equality, which AT knew perfectly well did not exist any longer in America, if it ever had... 

In context it is perfectly clear what AT was concerned with, but not everyone has always remembered the context. 

'Alexis de Tocqueville: Prophet of democracy in the age of revolution', Hugh Brogan; p. 275


[A new version of Tocqueville's Democracy in America is available here. The entire English translation can be downloaded for free here.]