
[Wilkinson and Pickett (W & P) have now responded to these questions. This post has been updated to show their answers, with my replies below. These are a set of straight-forward questions on simple points of fact that were raised on this blog in April 2010. Some websites have portrayed W & P's replies as being a response to the evidence and arguments in the book The Spirit Level Delusion. They're not. They have never responded to those, but their replies here are of interest all the same.]
1. Why do you exclude the Czech Republic, South Korea and Hong Kong from your analysis when all these societies are wealthier than Portugal?
Wilkinson & Pickett: There are different ways of measuring average income in different countries; the choice of measure makes small differences in precise ranking of countries by wealth. We chose countries ordered according to the Atlas Method, because this is used by the World Bank to classify countries into Low, Medium and High Income categories. Our source is the World Development Indicators Database, World Bank, April 2004*. From this list we selected the 50 richest countries, excluded those with populations less than 3 million and those without income inequality data from the United Nations. Our aim was to examine the impact of inequality on health and social problems among rich countries, where average levels of income are not related to health, happiness or well-being. Our selection criteria also mean that we only consider the older, rich, developed, market economies, and so allows us to compare like with like. The countries which our critics suggest we should fail to meet the criteria.
This is a key question and unfortunately W & P only reiterate what they said in the Appendix of The Spirit Level. I have never challenged their assertion that only wealthy Western industrialised nations should be included in the analysis. The question is which countries are "rich". Any cut-off point will be open to debate, but picking the top 50 for no other reason than that it is a round number is unnecessarily arbitrary.
W & P say that they selected the countries by picking those which appeared "on the flat part of the curve at the top right in Figure 1.1 on p. 7, where life expectancy is no longer related to differences in Gross National Income" (The Spirit Level, p. 280). This is simply not true. The image below is a close up of the countries in Figure 1.1. Hungary, the Czech Republic, Slovenia and South Korea (Hong Kong is not shown) are all on "the flat part" and are all shown as being richer than Portugal and yet they are not included.

All I do in The Spirit Level Delusion is include countries of similar or greater wealth that should—by W & P's own criteria—have been included in the first place. I have not added poorer countries in, rather I have included rich developed societies that W & P excluded without good reason.
The World Bank gives figures for the Atlas method (in US dollars) and Purchasing Power Parity (in international dollars). The latter is more appropriate for international comparisons—the whole point of international dollars is to facilitate international comparisons. Even using W & P's arbitrary top 50 cut-off point, the World Bank's figures for 2005 show:
(9) Hong Kong: $34,900
(45) Slovenia: $22,140
(46) South Korea: $22,010
(48) Portugal: $22,070
(50) Czech Republic: $19,560
And the figures for 2008 show:
(16) Hong Kong: $43,960
(44) South Korea: $28,120
(46) Slovenia: $26,910
(55) Czech Republic: $22,790
(59) Portugal: $22,080
Whichever data set is used, there is no justification for including relatively poor countries like Greece and Portugal while excluding several nations which are manifestly comparable.
If we wish to "compare like with like", it is particularly important to include Asian countries other than Japan, because they demonstrate that the supposed benefits of Japanese equality are actually the result of social and cultural factors unique to Asian societies. Although very unequal, Hong Kong and Singapore perform well under almost every criteria although the W & P hypothesis predicts that they should perform worst. This reveals a puzzling lack of a dose-response relationship.
[*Although published in 2004, the figures refer to 2002 - CJS]
2. Why do you exclude Singapore from your graph of mental illness when you included it in the same graph when it was published in Olivers James' Affluenza?
Wilkinson & Pickett: Comparing the prevalence of mental illness in different societies has long been thought to be problematic because of cultural differences in labelling mental illness or in help-seeking behaviours. To overcome these limitations, the World Health Organization established a consortium to provide international comparisons of the prevalence of mental illness. As referenced in The Spirit Level, we use these WHO estimates for Belgium, France, Germany, Italy, the Netherlands, Spain and the USA. We added in estimates from Canada, the UK and Australia because they used almost exactly comparable methods (diagnostic interviews of random samples of the population) to the WHO studies. We did not include a survey of mental illness from Singapore in either of our peer-reviewed publications on this topic, or in The Spirit Level, because the WHO surveys included questions on illegal drug abuse and, in 1988, the death sentence became mandatory in Singapore for manufacturing, importing, exporting or trafficking drugs in small quantities. Possession of small quantities was taken as prima facie evidence of trafficking. We therefore consider that self-reported estimates of mental illness in Singapore survey will be under-estimates. However, even if Singapore is included, there is still a statistically significant association between income inequality and mental illness (r=0.58, p=0.04).
This doesn't answer the question of why they included Singapore in the graph they created for Affluenza and The Selfish Capitalist. Drugs are illegal in all the countries studied in their graph and admitting to having used a substance in a confidential mental health questionnaire is not grounds for prosecution for possession, regardless of the severity of the punishment.
Rates of anxiety and mood disorders found in the Singapore study indicate that the position of Singapore in the Affluenza graph is about right (ie. about the same as France).
We will come back to the reliability of their mental illness graph in question 14.
3. Why do you say that the USA’s decline in homicide ended in 2005 when 2008 saw the lowest number of homicides since 1965? As you must know, America's murder rate has halved in the last two decades despite rising inequality.
Wilkinson & Pickett: We started writing The Spirit Level in January 2007 and delivered it to our publisher in February 2008, so clearly we could not have accessed homicide data from 2008 – typically official statistics are published 2-3 years post-collection. At time of writing (mid-2010), the most up-to-date data are for 2008.
The homicide rate in the USA has indeed declined, on average over the past two decades, whilst income inequality has been rising. But, as we discuss in The Spirit Level, and show here, there is a match over time between bottom-sensitive measures of income inequality and changes in homicide rates.
The Spirit Level contains references to several articles published after February 2008, but we shall let that pass. On this occasion, I accept that my criticism was too hasty. I accept that W & P would not have had the homicide data for 2008 before The Spirit Level was published in hardback. Presumably they will correct their claim that the murder rate started to rise again in 2005 in the future editions?*
The substantive point remains, however. America's murder rate is at its lowest level since 1965 and it was very premature for W & P to suggest that the 2005-06 blip represented the start of an upward trend. This seems a small point but it important to their overall argument. The reason W & P are so keen to claim that the murder rate began rising in the 2000s is that the huge decline in American homicide coincided with growing equality. The sharp but inconvenient decline in the murder rate (and of crime generally) from the early 1990s does not sit easily with their theory that inequality is the root cause of homicide. As shown in The Spirit Level Delusion and elsewhere, W & P's evidence for linking the two is extremely tenuous.
* (UPDATE 2011: The second edition has appeared and they have not.)
4. Why did you use older data for your life expectancy/inequality graph than you used elsewhere in The Spirit Level? Is it because more recent data show no correlation with inequality?
Wilkinson & Pickett: To avoid the effects of random fluctuations in inequality measures in each country, we took the average of inequality measures published in four consecutive years of the UN Human Development Report. We then matched outcome data (including life expectancy) as nearly as possible to the same time frame as the measures of inequality. When looking at life expectancy against National Income per head we again took the most up to date measures of those covering the same time frame. There are also many recent studies that demonstrate a relationship between income inequality and health, see for example the study of more than 60 million individuals by Kondo and colleagues.
This simply doesn't make any sense. W & P's national income data come from 2002, therefore it is logical to use life expectancy data from 2002. Instead they use data from 2004 (as published in the UN Human Development Report (UN HDR) 2006).
But when they look at inequality, they use life expectancy figures from 2002 (as published in the UN HDR 2004), even though their inequality figures are averaged out from several different years. A better explanation is that the older edition of the report was preferred because it provided slightly better evidence of a correlation between inequality and longevity, albeit only when W & P's selection of countries were used.
I am by no means the first person to have spotted Richard Wilkinson's tendency to be choosy about which sets of data he uses to make his case:
"He [Wilkinson] gives no satisfactory explanation about why "the poorest 70%" should be chosen, and the suspicion must be that the choise is derived from the data."
Ken Judge, 'Income distribution and life expectancy: a critical appraisal', British Medical Journal, 1995
"The strength of association between absolute income and life expectancy seems quite sensitive to which countries are included. What constitutes an appropriate set of countries of this sort is certainly open to debate. Nevertheless, we have shown that compared with Wilkinson's selection of 23 countries, the addition of the other 10 equally wealthy nations that constitute the full sample, significantly changes the results."
J. Lynch, P. Due, C. Muntaner & G. Davey Smith, 'Social capital - Is it a good investment strategy for public health?', Journal of Epidemiological and Community Health, 2000
"Although many aspects of this debate are still unresolved, it has recently become clear that the findings of that paper [Wilkinson, BMJ, 1992] were an artifact of the selection of countries... the evidence for a correlation between income inequality and the health of the population is slowly dissipating’
Johan Mackenbach, 'Income inequality and population health', British Medical Journal, 2002
W & P also mention the study by Kondo et al., published in the BMJ in 2009. They have a particular fondness for this study, which measured self-reported health. They cited it during the Royal Society of Arts debate and referenced it in their response to Peter Saunders. They also mentioned it in their response to an article I co-authored in the Wall Street Journal. In the latter, they insisted that it "shows unequivocally that inequality is related to significantly higher mortality rates."
In fact, the study concludes that:
The results suggest a modest adverse effect of income inequality on health, although the population impact might be larger if the association is truly causal... The findings need to be interpreted with caution given the heterogeneity between studies
This paper certainly gives more support to W & P's hypothesis than most, but it is anything but unequivocal.
5. You use the high rate of teen births in Portugal (in 2002) as proof that inequality is related to teen births. Why do you not mention that abortion was illegal in Portugal until 2007?
Wilkinson & Pickett: We do indeed show that teenage births are related to income inequality in rich countries, as have UNICEF. This is not dependent on Portugal; indeed if we exclude Portugal the relationship with inequality is slightly stronger, not weaker. In the USA, unlike internationally, data on teenage conceptions were available so we use those, rather than births, as they are unaffected by state differences in access to abortion, and we show the same robust relationship with inequality.
The relationship is not stronger without Portugal. Nor could it be, since Portugal is an unequal country with a high rate of teen birth (primarily the result of its high rate of teen marriages and low abortion rate). With Portugal dropped from the analysis, the r-squared drops from an already feeble 0.10 to 0.089.
I do not suggest that the correlation is dependent on Portugal, only that a ban on abortion is going to have a major effect on the birth rate and is an example of the kind of real-world differences that are routinely ignored in The Spirit Level. Throughout The Spirit Level, W & P refuse to acknowledge social, demographic, historical and cultural differences between nations unless those differences can be used to plug gaps in the theory.
For example, when Finland is seen to have a high rate of homicide, they are quick to point out that it has a high level of gun ownership, but, absurdly, they do not give the same benefit of the doubt to (unequal) places like Israel and the United States.
In the case of Portugal, two major, common sense explanations for the high level of teen births are staring them in the face (the other being Portugal's high rate of teen marriages) but since the high Portuguese figure superficially supports their hypothesis, these confounding factors are never acknowledged.
As I acknowledge in The Spirit Level Delusion, the UNICEF report mentions inequality as one possible explanation for teen births but it makes it clear that it is not the primary cause. As Peter Saunders has shown, English speaking countries tend to have higher teen births. The UNICEF document makes it clear that cultural differences provide a better explanation for teen birth rates than inequality. The low rates of teen births in Singapore and Hong Kong (not shown in The Spirit Level) give further support for this, as does the fact that the only non-Anglo nation with a higher rate of teen births is Portugal for the reasons given above.
6. Why do you not include the crime rate in your index of health and social problems? Is it because the crime rate tends to be higher in 'more equal' countries?
Wilkinson & Pickett: It has often been pointed out that homicides are one of the few crimes which can be compared reliably between countries. Comparisons of other kinds of crime are affected by differences in the law, in reporting, and by other extraneous influences. Car crime, for instance, is affected by the number of cars and rape is dramatically affected by reporting (see our answer to Q 19 below. While there are some research papers showing relationships between inequality and property crime, there are no sources of data (including those used by Snowdon) which deal adequately with these problems. Hence, we confined our attention to adult and juvenile homicide rates. There are more than 50 studies showing that inequality is related to violence, see for example the review by Hsieh and Pugh 25 and the recent study by Elgar and Aitken.
I mention the potential pitfalls of comparing recorded crime data in The Spirit Level Delusion, which is why I also show the results of the EU Crime Survey. The Crime Survey uses the same methodology for all countries and is based on people's experience of crime, whether recorded or not. Both data sets indicate higher levels of crime—particularly property crime—in more equal societies.
7. Why do you say that homicide is inversely related to suicide when there is no evidence for this?
Wilkinson & Pickett: In fact, there are several pieces of research which show that homicide rates are inversely related to suicide, see for example (44) (45)
Having spent so long fact-checking The Spirit Level, it came as no great surprise when I turned to the first study referenced by W & P and found that its conclusion read:
The overall correlation between homicide and suicide rates was weak and statistically insignificant
It is certainly true that homicide rates are higher in Africa and the Americas (this is confirmed in the second study they reference—see below), while suicide rates are higher in Europe.

Perhaps W & P would argue that this graph shows that suicide is inversely associated with homicide. I think most people would say that it shows that there is simply a much higher homicide rate in Africa and the Americas. There is reason to believe that rising prosperity leads to lower homicide rates and higher suicide rates. But when we compare the wealthy countries that are the focus of The Spirit Level, there is no correlation between suicide and homicide (see The Spirit Level Delusion, p. 82).
8. Why do you suggest that people in more equal countries give more to charity when the reverse is true?
Wilkinson & Pickett: We do not say that people in more equal countries give more to charity - instead we show that more equal countries donate more in development aid to foreign countries. We do cite Eric Uslaner’s work which shows that people who have high levels of trust are more charitable. Snowdon presents data from the Charities Aid Foundation, which suggests that more unequal countries (especially the USA) have higher levels of individual charitable giving. However, as the Charities Aid Foundation points out, charitable giving in the USA is heavily influenced by tax policy, and may also be a response to the exceptional need created by the US lack of social security systems. Only 3% of US charitable giving goes overseas, so total US donations to overseas development are substantially lower than other rich countries.
Low levels of US government aid are partly a reflection of low trust in government (strongly related to inequality) and also of a lack of social security and welfare provision. Together these shift the onus of support to wholly inadequate private charitable giving.
On page 60 of The Spirit Level, Wilkinson and Pickett write that:
"Not surprisingly, just as individuals who trust other people are more likely to give to charity, more equal countries are also more generous to poorer countries."
Bearing in mind that, at this point in the book, W & P have just 'proved' that people in egalitarian societies are more trusting of other people, how else is the reader supposed to interpret this sentence, other than as a claim that people in more equal countries give more to charity?
But they don't. They give less to charity, for reasons that are well-understood. The Charities Aid Foundation (CAF) certainly does point out that the USA's tax system encourages donations to charity. Are Wilkinson and Pickett suggesting that this is a bad thing? It seems that way. (nb. Only Sweden, Finland and Austria do not incentivise charitable giving).
The CAF also notes that people in high-tax countries are less likely to give to charity. This is hardly surprising, since people are less likely to give to charity if (a) they have less disposable income, and (b) they live in a society which expects the state to take responsibility for such matters. I address both issues in my book and quote the CAF.
Wilkinson and Pickett reveal their political bias with their dismissive attitude towards voluntary, private charity and their preference for publicly funded, compulsory aid. They are fundamentally wrong about all their assumptions given above. Low levels of government aid are not a response to lack of trust in government—the government decides the level, after all. Instead, they are the result of lower levels of taxation and a historical emphasis on private philanthropy. W & P are also wrong to say that total US aid (private + public) is "substantially lower" than that of other countries. The USA is consistently in the top 10 in both per capita terms and in absolute terms.
And they are wildly wrong when they make the unreferenced claim that only 3% of US donations goes overseas. This is just the kind of causal disregard for the truth that makes fact-checking The Spirit Level such an exhausting affair. Of the $307 billion the US gave to charity privately in 2008, $116 billion went overseas. That is 38%, not 3%. And while Americans prefer private donations to state-funded aid, the USA gives far more than 0.7% of its GDP to the developing world. (0.7% being the United Nations target.)
9. Why did Kate make a video called ‘Why Cubans live longer than Americans?’ when all the sources show that life expectancy in Cuba is lower than in the USA?
Wilkinson & Pickett: Kate was not consulted about the title for this online clip from a short interview. What she actually said was that countries such as Cuba, Costa Rica and some poorer European countries have life expectancy as high, or higher than, the USA. In fact, in the 2006 revision of the United Nations World Population Prospects report, for 2005-2010, infant mortality rates in Cuba were 5.1 per 1000 live births, compared to 6.3 for the United States, and life expectancy was in Cuba was 78.3 years, compared to 78.2 years in the USA.
It is difficult to believe that Pickett would have no say about the title of a video she presented, or would have no power to rename or withdraw the video once it was given a misleading title. But whoever named it can hardly be blamed, since she does indeed claim that Cuba and Costa Rica have life expectancies that are "as high or higher than the United States."
W & P's reference to the World Population Prospects report is another example of their habit of data-mining to find the 'right' figures. As they must know, that particular report gives a prediction, it is not a real figure. More reliable figures for life expectancy come from the UN HDR—the preferred source used in The Spirit Level. All of these reports show life expectancy being higher in the USA than in Cuba and Costa Rica. The most recent edition shows that life expectancy is 79.1 in the USA and 78.5 in Cuba. Costa Rica's life expectancy is 78.7.
10. Why do you write about "increased family break-down and family stress in less equal countries" when divorce and single-parent households tend to be more common in more equal countries?
Wilkinson & Pickett: Although lone parent families are not more common in more unequal countries, changes in income inequality are correlated with rising divorce rates in US counties.
This evades the question. The facts show that divorce is more common in more equal countries, and the Scandinavian countries have amongst the highest rates of lone parent families (as do some Anglo-Saxon countries). It is simply untrue to say that there is "increased family break-down and family stress in less equal countries".
11. Why do you say that community life is weaker in less equal countries when these nations have more people involved in community organisations (charities, sports clubs, environmental groups etc.)?
Wilkinson & Pickett: Robert Putnam’s measures of ‘Social Capital’ are based on membership of voluntary and community associations of the kind you mention. Both in his earlier study of the Italian regions and in his study of the American states he shows there is a very strong tendency for the more equal regions and states to have stronger community ties measured in this way. Looking at changes over time in the US as a whole he also says:
"Community and equality are mutually reinforcing... Social capital and economic inequality moved in tandem through most of the twentieth century. In terms of the distribution of wealth and income, America in the 1950s and 1960s was more egalitarian than it had been in more than a century. ...those same decades were also the high point of social connectedness and civic engagement. Record highs in equality and social capital coincided. Conversely, the last third of the twentieth century was a time of growing inequality and eroding social capital. By the end of the twentieth century the gap between rich and poor in the US had been increasing for nearly three decades, the longest sustained increase in inequality for at least a century. The timing of the two trends is striking: somewhere around 1965-70 America reversed course and started becoming both less just economically and less well connected socially and politically." p.359
Sociologists distinguish between generalized trust (trust of people with whom we do not have an intimate relationships) and particularized trust (trust of people like ourselves). Generalized trust is related to social capital, and many researchers, including Putnam, have linked these measures of social capital to greater equality. Indeed, they have shown that it is inequality that affects trust, rather than the other way round.
Again, this does not answer the question. The international evidence shows that people in less equal countries are more likely to be members of clubs, societies, sports associations, religious groups etc. The only exception is trade union membership, which is often compulsory or strongly 'encouraged'. The graph below shows data from the World Values Survey.

What Putnam shows is that membership of these kinds of groups has declined in the United States over the last fifty years (as it has elsewhere). But Putnam never endorses the theory that inequality is the cause of the decline in club membership or social capital.
Indeed, W & P's selective quoting from Putnam's Bowling Alone is a good example of how they provide the illusion of an academic consensus where none exists. In The Spirit Level, they quote the same passage as the one quoted above, with the same sections deleted. The unwary reader might interpret this quote as evidence that Putnam believes that inequality leads to less social capital.
But, as ever with W & P, it is what they do not show that is most instructive. The unabridged first line of this quote reads: "Community and equality are mutually reinforcing, not mutually incompatible." After the last line W & P quote, Putnam concludes: "This pair of trends illustrates that fraternity and equality are complementary, not warring values."
As these words suggest, Putnam is not arguing that income equality necessarily increases social capital, he is merely arguing that the former does not damage the latter. This is obvious from the section heading which asks the question: 'Is social capital at war with equality?'
Why would he ask that question? Because, as Putnam points out: "the abundant social capital of the 1950s was often exclusionary along racial and gender and class lines. Generally speaking the haves engage in much more civic activity than the have-nots." Because of this, it is sometimes argued that left-wing attacks on elitist social institutions weaken some forms of community life. Putnam argues that these fears are ill-founded, and he says the positive correlation between equality and social capital in the USA since the Second World War "powerfully contradicts the view that community engagement must necessarily amplify inequality."
But Putnam is far more cautious in claiming a causal link between income equality and social capital than W & P. In fact, this brief passage is the only part of his 500 page book that evens mentions income equality (R. Putnam, Bowling Alone, 2000; pp. 358-60). When he sums up the evidence to explain why community life has broken down in the USA since the 1950s, he identifies four factors ('generational change', 'television', 'work' and 'sprawl' - p. 284). He does not include inequality.
12. Do you accept that the World Values Survey data show no correlation between 'happiness' and inequality, but a strong correlation between 'happiness' and income?
[There are so many points to make about W & P's answer here that I have split it up]
[There are so many points to make about W & P's answer here that I have split it up]
Wilkinson & Pickett: We accept that there is no relation between inequality and WVS measures of happiness, but among the rich countries neither is there a relation between happiness and Gross National Income per head (see our figure 1.2 in The Spirit Level).
W & P's claim that there is no relationship between happiness (as measured by the World Values Survey) and Gross National Income is incorrect. As can be seen from the graph below, there is a clear correlation, even at a very high level of economic development.
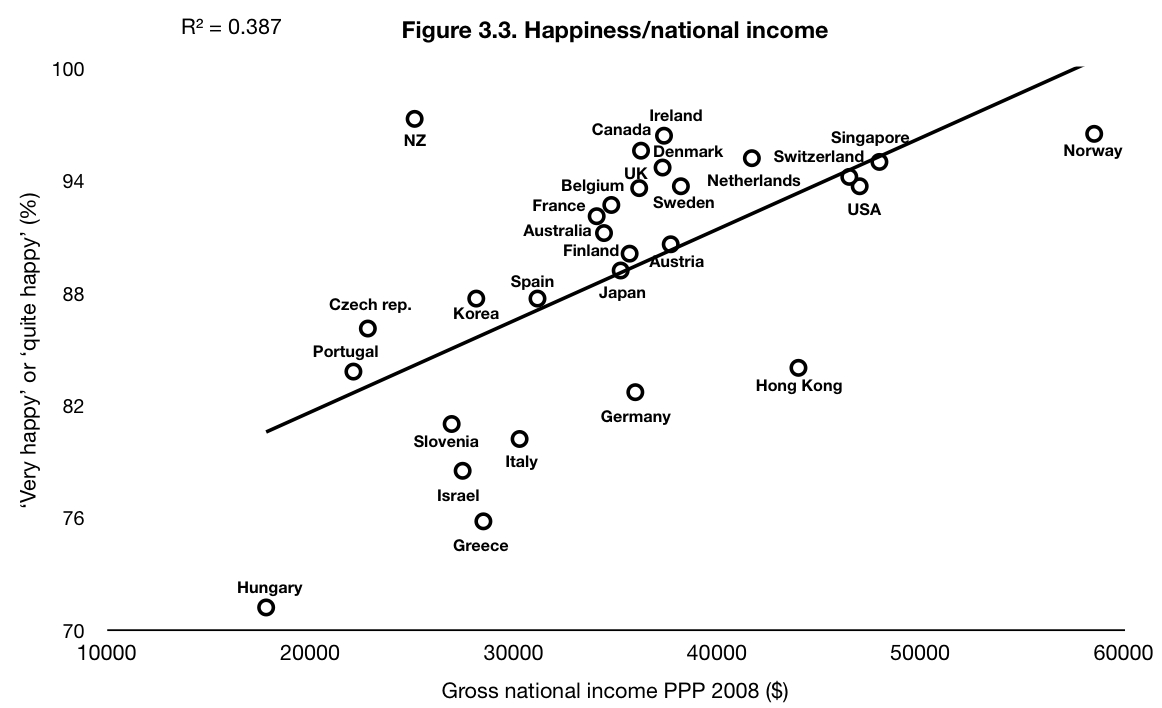
W & P never show this graph. Instead, they use a graph that shows rich and poor countries together (Spirit Level, p. 9), which obscures what is shown above. Consequently, they are able to begin their book by claiming that "happiness levels fail to rise further as rich countries get still richer". This is a crucial part of their argument, since it suggests that economic growth has "done its work"and can therefore be curtailed. It is, however, factually incorrect.
The other important thing about the happiness surveys is that they show no relationship with inequality. This is a crucial observation, since it is powerful evidence that more equal societies are not happier.

During the Royal Society of Arts debate, Richard Wilkinson responded to this evidence by claiming that happiness does not have a social gradient and, therefore, would not be affected by levels of inequality. This is not true. Any number of studies have shown that the rich are happier than the poor eg. Easterlin (1974). They have, however, now acknowledged this...
In our debate at the RSA, Richard meant to say that happiness and income have a reverse social gradient, rather than no social gradient. The correlation between income and happiness among individuals within countries has been shown to be a relationship with relative income and social status.
The correction is welcome* but the subsequent argument is weak. There are many reasons why the rich are happier than the poor. In part, their absolute income allows them to afford a better standard of living and, in part, their relative income allows them to compare themselves favourably to their peers. While both are important, the material benefits of absolute income receive short shrift in The Spirit Level. W & P focus only on relative income and claim that richer people are happier only because money buys status and status symbols. This is opinion, not fact.
It has also been shown that additional income makes much more difference to the happiness of the poor than the rich. This would suggest that redistribution would improve over-all happiness.
No. It suggests that additional income would improve the happiness of the poor. We should, therefore, pursue a system that will maximise increases in the incomes of the poor. There is no evidence that the zero-growth egalitarianism proposed by W & P will do that.
But the key argument in The Spirit Level is that the poor would become happier if the rich become poorer, even if the poor got no richer in the process. In other words, rounding up and deporting every millionaire in Britain would, in itself, be enough to improve social outcomes, even if no one got richer as a result. This is where W & P depart from the bulk of the scientific literature and, I would argue, from common sense.
Several economists who study happiness (e.g. Blanchflower and Oswald) show that, in sub-national analyses, more equal societies, for example more equal US states, are happier.
The majority of happiness studies have shown that inequality has no effect on happiness, which is why the happiness studies are not mentioned in The Spirit Level. (See, for example, reviews by Clark and Senik (2010) and Hopkins (2008).) Nor do Blanchflower and Oswald say that more equal states or countries are happier. This is a complete misrepresentation of the literature.
International comparisons of subjective variables, such as happiness, are notoriously unreliable (for example, self-reported health appears better in countries with higher death rates) This is why in The Spirit Level we concentrated very largely on objective measures of health and wellbeing.
Since the happiness surveys show no correlation with inequality and a strong correlation with income, it is perhaps unsurprising that W & P now choose to distance themselves from them. It is a shame they felt the need to put this "notoriously unreliable" data at the heart of the first chapter of their book. Note also, that the trust survey—upon which they base so many of their arguments—is a wholly subjective and self-reported measure. They also put great faith in the Kondo study (see question 4) which studies self-reported health.
[*A "reverse social gradient" implies a reverse relationship ie. that the poor are happier. Since even W & P cannot believe this (surely?), I assume this to be a slip of the pen.]
13. On page 19 of The Spirit Level, you say you included alcohol addiction as a 'health and social problem', but you never discuss it in the rest of the book. Is this because the highest rates of alcoholism are in Scandinavia?
Wilkinson & Pickett: It is important to distinguish between alcohol use and alcohol abuse. Alcohol use is difficult to measure and often has no social gradient – consumption tends to be higher in higher social classes. This is in marked contrast to binge and problem drinking. We include alcohol abuse (as measured by surveys of mental illness that cover drug and alcohol addiction) in our Index of Health and Social Problems, and have previously demonstrated a significant relationship between deaths from alcohol-related liver disease and income inequality in US states.
I agree about making a distinction between per capita alcohol consumption and overall alcohol consumption, but several international surveys of mental illness surveys have shown that the more equal Scandinavian countries have the highest levels of alcohol abuse. It would be interesting to see what W & P's alcohol abuse graph looks like. It does not appear in The Spirit Level and the data is not included in their spreadsheet.
14. Why do you show no data about the (high) prevalence of mental illness in Scandinavia?
Wilkinson & Pickett: The World Health Organization has not yet produced internationally comparable data on mental illness for Scandinavian countries, but we eagerly await such data. In the absence of robust estimates from the WHO, we know of no high quality data to justify the suggestion that Scandinavian countries have a higher prevalence of mental illness.
W & P's mental illness graph provides one of the most egregious examples of data-mining in The Spirit Level. Much more evidence for mental illness prevalence exists than is shown in The Spirit Level and, although W & P are implying otherwise, they do not confine themselves to "robust estimates from the WHO". The figures they use for the UK, Australia, New Zealand and Canada (all less equal countries) come from other sources. When more than one source is available, W & P consistently pick the figure that best suits their hypothesis. As I explain in The Spirit Level Delusion, there are serious questions about the reliability of some of the figures from the WHO study, which the study's authors acknowledge.
I don't claim that rates of mental illness are necessarily "higher" in Scandinavia, but the available evidence suggests that they are as high as in the United States. For example, a large study of all four Nordic states concluded:
Overall, it can be concluded that the prevalence rate of generalized anxiety disorder and major depression in different European countries, including Denmark, Finland, Norway, and Sweden, are as high as those found in the United States. (‘Prevalence of generalized anxiety disorder in general practice in Denmark, Finland, Norway, and Sweden’, P. Munk-Jorgensen, Psychiatric Services, 57 (12), December 2006; p. 1738-44)
Similarly, a study of mental health in Norway compared rates of the most common mental disorders with those in the USA and found "almost identical rates for alcohol abuse, major depression, and social phobia in the two countries." (‘A Norwegian psychiatric epidemiological study’, E. Kringlen et al., American Journal of Psychiatry, 2001, 158; pp. 1091-98)
Incidentally, the largest systematic review of the prevalence of mental disorders in the EU (Wittchen & Jacobi, 2005 - summarised here (p. 47)), found the 12 month average to be 27%—ie. almost identical to estimates from the USA.
15. If equality creates good health, why does Denmark currently have the lowest life expectancy of any country in your list?
Wilkinson & Pickett: As with our other analyses, we (unlike our critics) do not pick and choose different countries to include or exclude according to whether or not their outcomes fit the inequality data. Denmark does indeed have much lower life expectancy than we would expect given its level of inequality. We have never claimed that income inequality is the only cause of worse health and social problems in a society. There will always be countries that do a bit better or worse on any outcome than we might predict given their level of inequality. Some researchers have attributed Denmark’s relatively poor health to its high levels of smoking.
Denmark doesn't have a particularly high level of smoking (see page 24 of SLD) and there is surprisingly little correlation between high smoking rates and low life expectancy when whole nations are compared. This only serves to highlight the problem of looking for the effect of one variable amongst aggregate data.
The simple fact is that the Scandinavian countries all have a very low level of inequality but vary wildly when it comes to life expectancy. Using data from the most recent UN HDR, out of 28 countries Sweden comes 8th, Norway comes 12th, Finland comes 19th and Denmark comes 27th.
Japan comes 1st, and this is the jewel in W & P's crown since Japan has an even lower level of inequality (by their measure, at least). But very unequal Hong Kong comes 2nd. Of course, readers of The Spirit Level will not know that because—although W & P "do not pick and choose different countries to include or exclude according to whether or not their outcomes fit the inequality data"—Hong Kong is never shown.
16. Why were Singapore and Hong Kong excluded from your graph on obesity?
Wilkinson & Pickett: The International Obesity Taskforce did not report data on obesity for Singapore in the 2002 report which was available when we were writing The Spirit Level. Hong Kong is not a nation state but even if it were it does not meet our inclusion criteria (see point 1).
The Singapore figure was published in 2004. The IOTF currently cites this figure so presumably we can expect it to appear in future editions of The Spirit Level.*
Hong Kong's somewhat unusual political status is no reason to exclude it. It is a country and both the World Bank and the United Nations treat it as such and collect data for it as a separate entity. It is certainly a separate and distinct society and The Spirit Level's subtitle is 'Why More Equal Societies Almost Always Do Better'. If US states fall under the category of separate societies, it is surely reasonable to include Hong Kong.
Why wouldn't Hong Kong meet the inclusion criteria? It has a population of over 7 million, it has sound data on inequality and came 16th in W & P's preferred list of rich countries.
* UPDATE 2011: The second edition is out and it is still missing.
17. Do you accept that the "correlation" between trust and equality rests entirely on figures from the four Nordic countries and that there is no pattern amongst the remaining 19 nations?
Wilkinson & Pickett: Absolutely not. These countries are NOT outliers, but lie on the trend line. However, even if they are excluded there is still a statistically significant correlation among the remaining countries (r=-0.46) as well as among US states where the correlation between trust and inequality is also highly significant (r=-0.7).
Again, this depends on which data are used. W & P's trust data come from the 1990s. If you use World Values Survey data from the 2000s, it is clear that the Scandinavian countries are outliers. The correlation disappears when they are excluded (see below). Even if you prefer W & P's older data set, their correlation is extremely weak.

18. Why do you say that young people "defer sexual activity" in more equal countries when there is no evidence for this?
Wilkinson & Pickett: We don’t say that people defer sexual activity in more equal countries – we simply discuss Professor Jay Belsky’s theory about quality versus quantity reproductive strategies which biologists have identified in many species.
W & P certainly do discuss Jay Belsky's theory that—as they put it—"people who grow up learning 'to perceive others as trustworthy, relationships as enduring and mutually rewarding and resources more or less constantly available' would mature later, defer sexual activity, be better at forming long-term relationships and invest more heavily in their children's development."
W & P precede this discussion by saying "there seem to be additional reasons why teenage motherhood is sensitive to degrees of inequality in society". They follow it by saying: "So there may be deep-seated adaptive processes which lead from more stressful and unequal societies." Apparently the reader should not infer from this that women in more equal societies defer sexual activity?!
19. If greater equality makes countries less violent and more law-abiding, why does Sweden have the highest rate of rape and theft of any country in your list? Why does Finland have the highest murder rate in Europe?
Wilkinson & Pickett: As we discuss in The Spirit Level, there are multiple influences on health and social problems, and income inequality is only one factor (albeit a strong and robust factor, demonstrated in more than 50 studies) affecting murder rates. Finland has a higher rate of homicides than we would predict, given its level of inequality, probably because of its high level of gun ownership. If we control for gun ownership in US states, the relationship between inequality and homicides actually gets stronger. For crimes other than homicides, comparing crime data among different countries is problematic, due to reporting differences. It seems sensible to assume that rape is more likely to be reported in societies where women’s status is higher.
It is not true that "more than 50 studies" have found a "strong and robust" association between inequality and homicide. Again, W & P mention a third variable (gun ownership) when they discuss Finland but do not give the same benefit of the doubt to Israel and the USA. In The Spirit Level, they do the same when trying to explain how the most equal state (Alaska) has one of the highest rates of homicide. They also make the questionable assumption that murders in America are carried out with legal firearms.
The assumption that Sweden has the highest rate of recorded rape because women are more likely to report sexual assaults is pure supposition.
20. Since when has the definition of a tax haven been a country with fewer than 3 million inhabitants? Isn't this just an excuse to leave out Slovenia?
Wilkinson & Pickett: The cut off for a small country has to be defined somehow – countries with populations around our 3 million cut-off point include Slovenia, Namibia, Lesotho, and Botswana. Slovenia is the only rich country with close to 3 million inhabitants excluded from our analyses. What happens if we add it in? Not much – the correlation between income inequality and homicides is r=0.42 (p=0.04) with Slovenia in, and r=0.43 (p=0.04) with Slovenia out. For imprisonment, the correlation with Slovenia in is r=0.66 (p<0.001), with Slovenia out, it is r=0.65 (p<0.001)….etc
No, the cut-off for a small country does not have to be defined somehow. A cut-off is completely unnecessary. All we need to know is which countries are tax havens (is Switzerland not a tax haven?). All the 3 million cut-off does is exclude Slovenia.
And, yes, including Slovenia often doesn't make a great deal of difference. That's isn't the point. We don't pick and choose the countries on the basis of whether they will make a difference. We include them so we have the full range of rich societies upon which to base our conclusions. Since The Spirit Level's conclusion is that "it falls to our generation to make one of the biggest transformations in human history" (p. 265), it would prudent to make sure the assumptions it is based on are not plucked out of the air.
It should also be noted that in one of their published studies, Wilkinson and Pickett "included only countries that had income inequality data and were among the richest 50 in the world and excluded those with populations of 50 in the world and excluded those with populations of less than two million to avoid possible tax havens." This allowed them to include Slovenia which, for the criterion studied in that paper, happened to strengthen the desired relationship. The switch from two million in this study to three million in The Spirit Level did not weed out any tax havens and served only to exclude Slovenia.
And finally...
A word about the scientific literature. W & P are fond of claiming that their work is backed up by 100s of peer-reviewed studies. In a recent letter to The Guardian, for example, they once again referred to "hundreds of other academic research papers which show similar patterns."
Do not be fooled. Very few of the studies referenced in The Spirit Level claim that health or social problems are caused by income inequality per se (as opposed to absolute income or other socio-economic factors). Of the few that do make such a case, many were written by Richard Wilkinson and/or Kate Pickett (they refer to no fewer than twelve of their own studies in The Spirit Level).
The bulk of the references are to newspaper articles, opinion pieces, other people's books, studies that discuss specific issues (eg. stress, violence, obesity) and the sources of the raw data (eg. UN, OECD). Often the studies referenced give equivocal support or contradict W & P (see Questions 4 & 7, for examples). The only area which has a significant body of scientific literature is health and inequality, and much of it disagrees with Wilkinson's hypothesis. As Wilkinson admitted in a recent interview with the magazine International Socialism, there is virtually no evidence from other academics to support the bulk of the claims made in The Spirit Level.
Wilkinson: "There are about 200 papers on health and inequality in lots of different settings, probably 40 or 50 looking at violence in relation to inequality, and very few looking at any of the other things in relation to inequality. In a way, the new work in the book is all these other variables—teenage births, mental illness, prison populations and so on—and the major contribution is bringing all of that into a picture that had previously been just health and violence."
These are, then, very much W & P's own ideas. Although The Spirit Level has launched their theories into the popular consciousness, they find little support in the scientific literature. It is no surprise, then, that their book has received a much cooler reception from academics (see below) than from ex-politicians and journalists.
"The bottom line is that this is a well-written, stimulating polemic. It nevertheless suffers from the same problems as one-trick ponies: if the one trick does not impress you, the show is a failure. Wilkinson and Pickett’s trick simply does not hold up to empirical scrutiny. When assessing this book as a contribution to the debate on the “right” level of income differences in modern society, it is a highly interesting, sympathetic attempt at addressing some of the important problems of Western societies. Yet, when assessing this book from a scientific point of view, one is forced to conclude that it is a failure."
— Christian Bjornskov, Professor of Economics, University of Aarhus, Population and Development Review, June 2010
"Wilkinson and Pickett have no time for nicely balanced judgements. They believe that the evidence they present shows beyond doubt that more equal societies ‘do better’, and they are also confident that they have the right explanation for why this is so... Their case is by no means so securely established as they try to make out... it has been called into question by other leading figures in the field – a fact that WP might have more fully acknowledged... WP’s inadequate, one-dimensional understanding of social stratification leads to major problems in their account of how the contextual effect is produced."— John Goldthorpe, Emeritus Professor of Sociology, Nuffield College, Oxford; ‘Analysing social inequality’ European Sociological Review, 2009
"The evidence in The Spirit Level is weak, the analysis is superficial and the theory is unsupported."
— Peter Saunders, Emeritus Professor of Sociology, University of Sussex, Beware False Prophets
"The book will probably irritate most economists, including those like me who are sympathetic to its basic stance... source of irritation is the authors’ apparent belief that the application of regression methods to economic and social statistics is as novel to social science as it apparently is to medicine. The evidence presented in the book is mostly a series of scatter diagrams with a regression line drawn through them. If you remove the bold lines from the diagram, the pattern of points mostly looks random, and the data dominated by a few outliers... An obvious conclusion is that there are many societies which perform well in terms of their own criteria. America, Sweden and Japan are just different from each other. Their achievements are not really commensurable. But Wilkinson and Pickett are not content with this relativist position."— John Kay, former Director of Institute of Fiscal Studies and Professor of Economics at London Business School, Financial Times, 2009
UPDATE
Sanandaji et al. have also written a detailed response to Wilkinson and Pickett's rebuttal of their criticisms. If you are interested in the debate about The Spirit Level (and, if you've got this far, you probably are!), I warmly recommend it. Click here.